
JVM Execution Engine - From Bytecode to Native Code
Explore how the JVM Execution Engine transforms bytecode into running code. Learn how the Interpreter, JIT Compiler, Code Cache, hotspot detection, and Garbage Collector work together to deliver high-performance Java applications.
Introduction
In our previous articles, we've explored how the JVM loads classes and organizes memory. We learned about the Class Loader hierarchy, Heap structure, Stack frames, and the separation between shared and thread-local memory areas.
But after classes are loaded and memory is allocated, how does the JVM actually execute your code? And how does Java achieve performance comparable to—or even exceeding—compiled languages like C++?
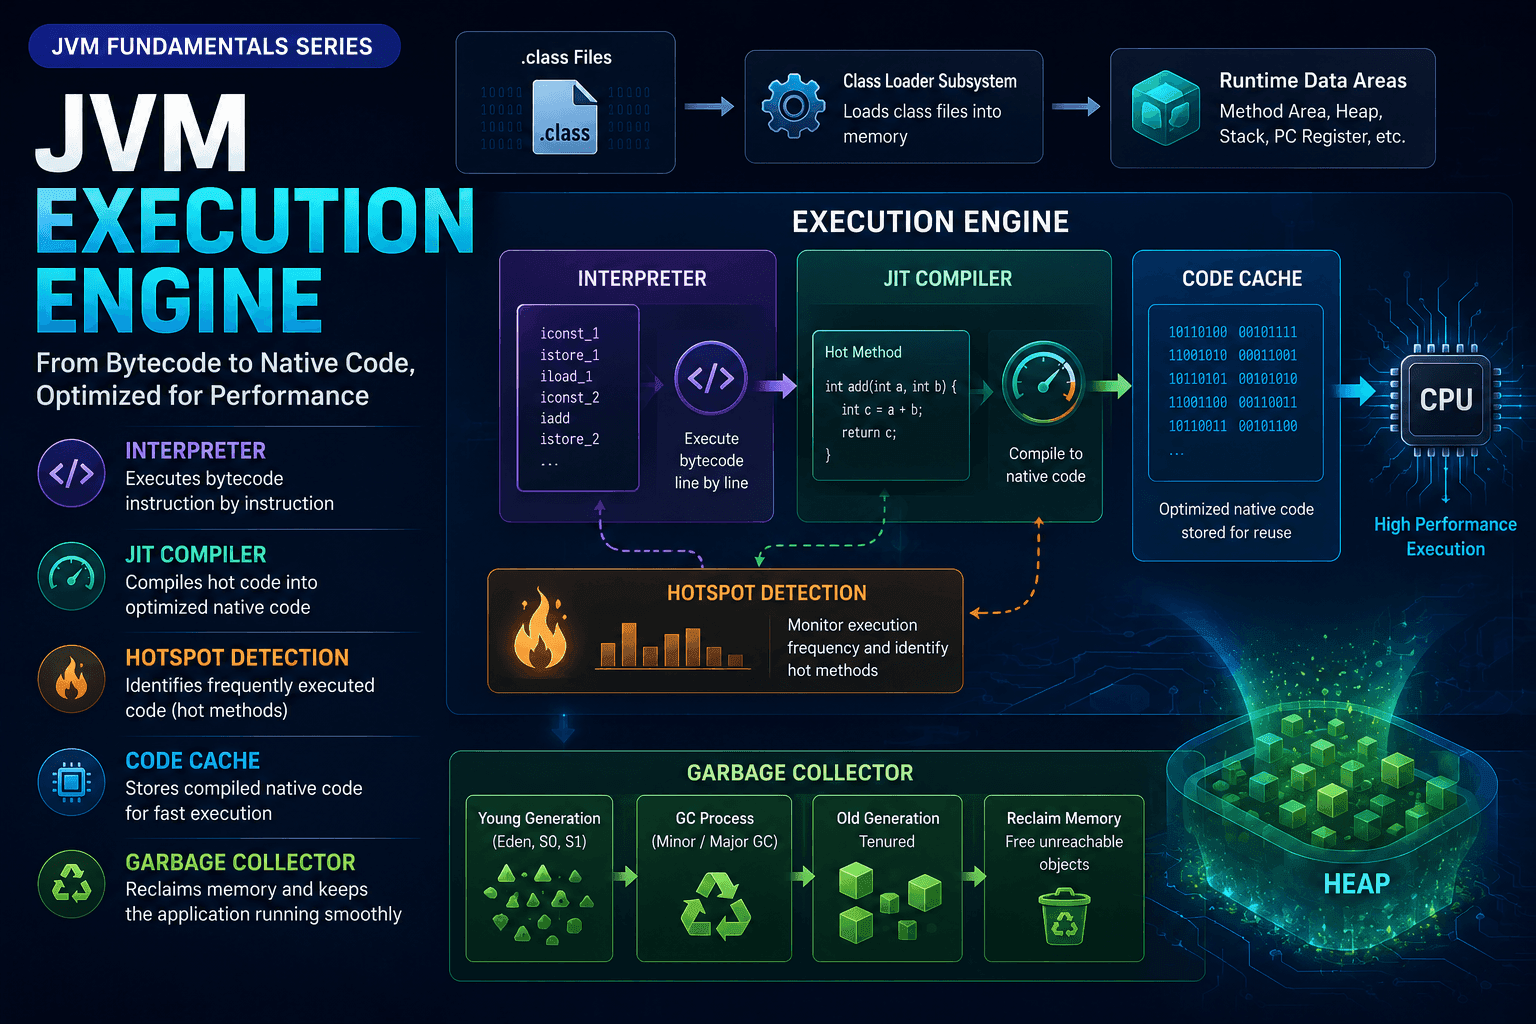
This is where the Execution Engine comes into play. The Execution Engine is the JVM component that breathes life into your bytecode, transforming it from static instructions into running programs. It consists of three main components:
- Interpreter: Executes bytecode instructions one by one
- JIT Compiler: Compiles frequently executed bytecode into optimized native machine code
- Garbage Collector: Automatically reclaims memory from unused objects
Understanding the Execution Engine is crucial for:
- Performance optimization: Know how the JIT optimizes your code and when to expect performance improvements
- Debugging: Understand execution flow from bytecode to native code
- Application profiling: Identify hotspots and optimize critical paths
- Memory management: Comprehend how GC impacts application performance and responsiveness
In this article, you'll master how the JVM executes bytecode, from the initial interpretation phase through JIT compilation with hotspot detection, to automatic garbage collection that keeps your application running smoothly.
Execution Engine
The Execution Engine is the component that actually runs your Java program. Once classes are loaded by the Class Loader and memory is allocated in the Runtime Data Areas, the Execution Engine takes over to execute the bytecode instructions.
The Execution Engine has three main responsibilities:
- Interpret bytecode instructions sequentially (via the Interpreter)
- Optimize frequently executed code by compiling it to native machine code (via the JIT Compiler)
- Reclaim memory from objects that are no longer in use (via the Garbage Collector)
This multi-layered approach allows Java to start quickly (using the Interpreter) while achieving high performance in long-running applications (using the JIT Compiler).
Interpreter
The Interpreter is the first component to execute bytecode when your application starts. It reads bytecode instructions one by one, decodes them, and executes them immediately—without any compilation step.
This is the initial startup phase before the Execution Engine compiles any code into native machine code.
Operating Model of the Interpreter:
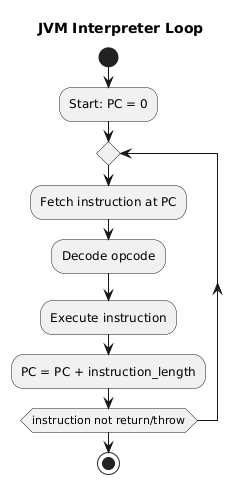
In simple terms, the operating principle of the JVM Interpreter can be understood as follows:
- The Interpreter reads bytecode instructions from the PC Register
- Decodes the bytecode it has read
- Executes the decoded instructions sequentially
- After executing a set of instructions, the Interpreter loops back to read the next bytecode instruction and repeats the process
Example:
Consider a simple Java method:
int sum(int a, int b) {
    return a + b;
}
This method is compiled into bytecode:
0: iload_1     // load a
1: iload_2     // load b
2: iadd        // add them
3: ireturn     // return result
The Interpreter executes the following steps:
| PC (Program Counter) | Instruction | Execution |
|---|---|---|
| 0 | iload_1 | Push a onto the operand stack |
| 1 | iload_2 | Push b onto the operand stack |
| 2 | iadd | Pop a and b, add them, and push the result |
| 3 | ireturn | Return the result |
Characteristics of the Interpreter:
- Simple and straightforward: Executes bytecode directly without compilation
- Fast startup: No compilation overhead, so the application starts quickly
- Slower execution: Each bytecode instruction must be decoded every time it's executed
- No optimization: The Interpreter doesn't perform advanced optimizations
The Interpreter is ideal for:
- Applications with short execution times
- Code that runs infrequently
- Initial startup phase before the JIT Compiler takes over
However, for long-running applications or frequently executed code paths, the Interpreter's performance becomes a bottleneck. This is where the JIT Compiler comes in.
JIT Compiler - Just-In-Time Compiler
The JIT (Just-In-Time) Compiler is an optimizing compiler in the JVM responsible for compiling bytecode into native machine code at runtime to improve performance, instead of compiling the entire program ahead of execution.
The JIT identifies frequently executed code paths (hotspots) and compiles them into high-performance machine code, storing them in the Code Cache for reuse. This allows Java applications to run significantly faster than using the Interpreter alone. This mechanism enables Java to achieve high performance comparable to—or even exceeding—traditional compiled languages like C++ in long-running applications.
Hotspot Detection
So, how does the JIT know which code is a hotspot?
The JVM uses a mechanism called HotSpot Profiling:
- Each method has an Invocation Counter that tracks how many times it's called
- Each loop has a Back-edge Counter that tracks how many times it iterates
- When the number of method calls or loop iterations exceeds a certain threshold, the JVM marks that code as a hotspot
➡ This means the JIT optimizes only the code that truly matters for performance.
Example:
public void processOrders() {
    for (int i = 0; i < 100000; i++) {
        calculateDiscount(orders[i]);  // Called 100,000 times → becomes a hotspot
    }
}
After calculateDiscount() is called thousands of times, the JIT recognizes it as a hotspot and compiles it to native code.
Compilation Process
How does the JIT compile bytecode into native code?
When a code segment becomes a hotspot:
- The JVM sends the bytecode to the JIT Compiler
- The JIT performs advanced optimizations (see below)
- The JIT compiles it into the CPU's native machine code (x86_64, ARM64, RISC-V, depending on the platform)
- The machine code is stored in the Code Cache
➡ Subsequent executions run the native code directly, without using the Interpreter.
Why is the JIT compiler more optimized than ahead-of-time compilation?
The JIT can optimize better than traditional compilation because:
-
The JIT knows exactly how the program runs at runtime For example: which methods are called most frequently, the actual types of objects, which branches are always taken, etc.
-
Common optimizations include:
- Inlining: Embeds the method body at the call site → reduces call overhead
- Dead Code Elimination: Removes unnecessary code that never executes
- Escape Analysis: Determines if an object can be allocated on the stack instead of the heap
- Loop Unrolling: Optimizes loops by reducing loop overhead
- Branch Prediction Optimization: Optimizes frequently taken branches
➡ The JIT generates native code that best fits the actual runtime behavior, making Java performance in long-running backend services extremely high.
Types of JIT Compilers
HotSpot (the default JVM from Oracle/OpenJDK) uses two main JIT compilers:
| JIT Compiler | Characteristics | Use Case |
|---|---|---|
| C1 (Client Compiler) | Fast compilation, light optimizations | Applications requiring fast startup |
| C2 (Server Compiler) | Deep optimizations, high-performance native code | Backend services, microservices, ML, Big Data |
Tiered Compilation (Java 8+)
Modern JVMs use Tiered Compilation, which combines both compilers:
Interpreter ➡ C1 (quick optimization) ➡ C2 (deep optimization)
How it works:
- Tier 0: Code starts in the Interpreter
- Tier 1-3: Frequently executed code is compiled by C1 with profiling
- Tier 4: Hottest code is recompiled by C2 with maximum optimizations
This approach provides:
- Fast startup: Interpreter starts immediately
- Quick optimization: C1 provides early performance gains
- Maximum performance: C2 optimizes the critical paths
Code Cache
The Code Cache is a special memory area where the JIT stores compiled native code. Once bytecode is compiled to native code, it's cached here for reuse.
Characteristics:
- Fixed size (configurable via
-XX:ReservedCodeCacheSize) - If the cache fills up, the JIT stops compiling new code
- Can be monitored and tuned for optimal performance
Key insight: The combination of Interpreter + JIT + Code Cache allows Java to:
- Start quickly (no ahead-of-time compilation delay)
- Run fast (native code execution for hot paths)
- Adapt to runtime behavior (profile-guided optimization)
This is why well-written Java applications can match or exceed C++ performance in long-running scenarios!
Garbage Collector
The Garbage Collector (GC) is a crucial component of the Java Execution Engine, responsible for automatically managing Heap memory. The GC detects and frees unreferenced objects, preventing memory leaks, reducing pointer errors, and optimizing performance without requiring manual memory management like in C/C++.
Thanks to the GC, Java developers can focus on business logic instead of worrying about memory allocation and deallocation.
How Garbage Collection Works
1. Identifying "garbage" objects:
The GC tracks all objects in the Heap. An object is considered garbage when:
- No variable or reference points to it
- It cannot be reached from GC Roots (thread stacks, static fields, JNI references, etc.)
This model is called reachability analysis—the GC only retains objects reachable from GC Roots.
Example:
public void processData() {
    String temp = new String("temporary");  // Object created
    // ... some processing ...
}  // temp goes out of scope → object becomes eligible for GC
Once the method exits, temp is no longer reachable from any GC Root, making the String object eligible for garbage collection.
2. Memory reclamation:
Once an object is identified as garbage, the GC automatically deletes it and reclaims its memory for future allocations. This process occurs entirely within the JVM, without developer intervention.
The GC uses different algorithms depending on the memory region:
- Young Generation: Uses fast, copying algorithms (Minor GC)
- Old Generation: Uses mark-sweep-compact algorithms (Major GC / Full GC)
Benefits of Garbage Collection
- Reduces programming burden: No need for
free()ordelete, saving cognitive load - Prevents critical errors: Reduces memory leaks and dangling pointers
- Optimizes performance: Efficient memory management helps maintain smooth application execution
- Enables safer multithreading: No risk of one thread freeing memory still in use by another thread
GC Trade-offs
While automatic garbage collection is powerful, it does have trade-offs:
- Stop-the-world pauses: GC may pause application threads during collection
- Memory overhead: GC requires extra memory for tracking and bookkeeping
- Non-deterministic timing: You can't precisely control when GC runs
Understanding GC behavior is essential for:
- Tuning application performance: Choose the right GC algorithm for your workload
- Debugging memory issues: Identify memory leaks or excessive object creation
- Capacity planning: Understand heap sizing and GC overhead
For more details on heap structure and object lifecycle, see our article on JVM Memory Management.
Conclusion
Understanding how the JVM executes your code is essential for building high-performance Java applications. In this article, we've explored the three components of the Execution Engine:
Interpreter:
- Executes bytecode directly, instruction by instruction
- Provides fast startup with no compilation overhead
- Ideal for short-lived applications or infrequently executed code
JIT Compiler:
- Identifies hotspots through profiling (invocation counters and back-edge counters)
- Compiles frequently executed bytecode to optimized native machine code
- Uses tiered compilation (C1 → C2) for both fast startup and maximum performance
- Stores compiled code in the Code Cache for reuse
- Performs advanced optimizations: inlining, dead code elimination, escape analysis, loop unrolling
Garbage Collector:
- Automatically manages heap memory through reachability analysis
- Reclaims memory from unreferenced objects
- Prevents memory leaks and dangling pointers
- Enables developers to focus on business logic rather than manual memory management
Key Insights:
- Adaptive optimization: The combination of Interpreter + JIT allows Java to start quickly and run fast
- Runtime intelligence: The JIT optimizes based on actual program behavior, not static analysis
- Automatic memory management: GC handles complex memory lifecycle without programmer intervention
- Performance: Well-tuned Java applications can match or exceed C++ performance in long-running scenarios
This completes our JVM Fundamentals series! You now understand:
- How classes are loaded through the Bootstrap, Platform, and Application ClassLoader hierarchy
- How memory is organized across Heap, Stack, Metaspace, and thread-local areas
- How code is executed from bytecode interpretation to JIT compilation and garbage collection
With this foundation, you're equipped to:
- Optimize Java application performance
- Debug complex memory and execution issues
- Make informed architectural decisions
- Tune JVM parameters for your specific workload
📚 Series Navigation
Previous in Series: JVM Memory Management — Heap, Stack, and Runtime Data Areas
Explore how the JVM organizes memory, from generational heap structure to stack frames and thread-local memory areas.
Start from the Beginning: JVM Architecture & Class Loading — Understanding Java's Foundation
Learn how the JVM loads classes dynamically and why lazy loading is fundamental to Java's flexibility.
This article is part of the JVM Fundamentals Series. Each post builds on the previous one to give you a comprehensive understanding of how Java applications run under the hood.
Comments
Loading comments…